library(tidyverse)Lab 6
Learning Goals
- Critiquing visualizations that misrepresent data
- Improving data visualizations to better convey the right message
Getting started
Go to Duke Container Manager and create a new folder titled lab-6 - Ethics.
Download the files from Canvas and upload them into the new folder you created in step 1.
Complete the exercises in this document.
Ethics
Packages
We’ll use the tidyverse package for much of the data wrangling and visualization.
Data
In this lab you’ll construct the data set!
Exercises
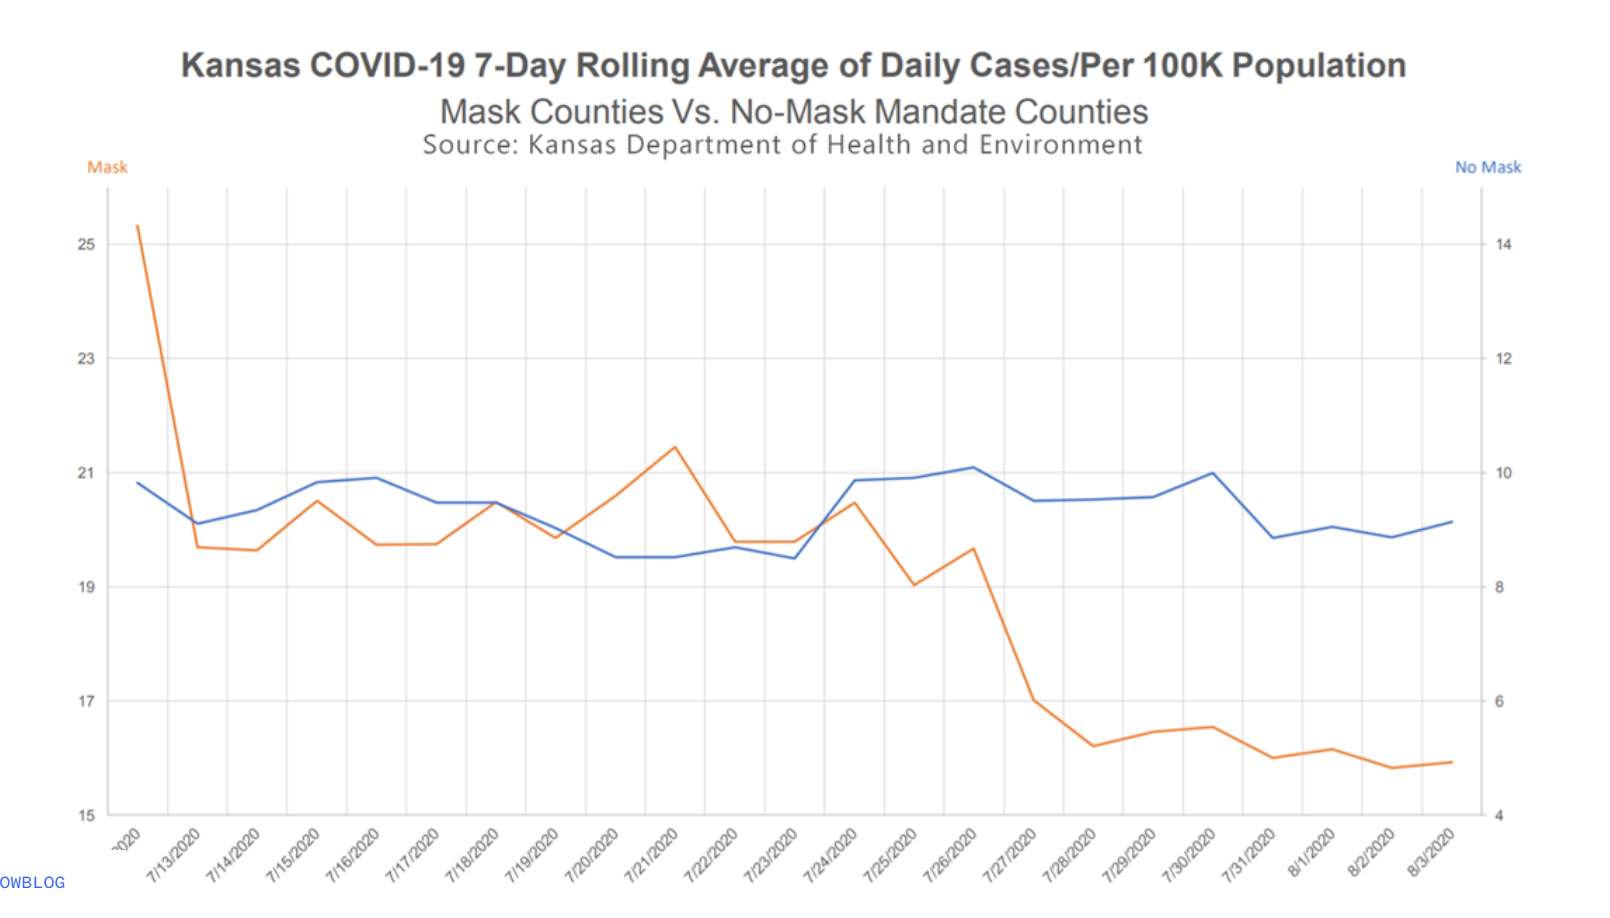
The following visualization was shared on Twitter as “extraordinary misleading”.

Exercise 1
What is misleading about this visualization and how you might go about fixing it?
Exercise 2
Create a data frame that can be used to re-construct this visualization. You may need to guess some of the numbers, that’s ok. You should first think about how many rows and columns you’ll need and what you want to call your variables. Then, you can use the tribble() function for this. For example, if you wanted to construct the following data frame
df <- tribble(
  ~date, ~"mask", ~"no mask",
  "1/1/2020", 15, 20,
  "2/1/2020", 20, 18,
  "3/1/2020", 22, 23
)
You can create the data frame below. Print the first 5 rows of the data frame after creating it. You may name the data frame what you like. We often try and keep data frame names small and informative.
Exercise 3
Make a visualization that more accurately (and honestly) tells the story. (Hint: use pivot_longer() function to change the shape of your dataset so that it has three colums: date, count, and county_type).
Exercise 4
What message is more clear in your visualization than it was in the original visualization?
Exercise 5
- What, if any, useful information do these data and your visualization tell us about mask wearing and COVID? Answers should focus only on what the visualization tells.
Wrap up
Submitting
Before you proceed, first, make sure that you have updated the document YAML with your name! Then, render your document one last time, for good measure.
To submit your assignment to Gradescope:
Go to your Files pane and check the box next to the PDF output of your document (
lab-6.pdf).Then, in the Files pane, go to More > Export. This will download the PDF file to your computer. Save it somewhere you can easily locate, e.g., your Downloads folder or your Desktop.
Go to the course Canvas page and click on Gradescope and then click on the assignment. You’ll be prompted to submit it.
Mark the pages associated with each exercise. All of the papers of your lab should be associated with at least one question (i.e., should be “checked”).
If you fail to mark the pages associated with an exercise, that exercise won’t be graded. This means, if you fail to mark the pages for all exercises, you will receive a 0 on the assignment. The TA can’t mark your pages for you, and for them to be able to grade, you must mark them.
Grading
| Component | Points |
|---|---|
| Ex 1 | 5 |
| Ex 2 | 5 |
| Ex 3 | 15 |
| Ex 4 | 5 |
| Ex 5 | 5 |
| Total | 35 |
